Welcome to the second part of our blog series on Data Quality! In this article we continue with the next three dimensions: Consistency, Validity and Accuracy. Keep reading to learn how you can extract meaningful insights from your data.
We are also sharing posts and previews on channels like Instagram, TikTok, LinkedIn and YouTube. Feel free to join the communities over there and keep up to date on Data Quality, Governance, SQL, Data Integration, Analytics and much more!
A short recap: What is Data Quality?
Data Quality (DQ) is the assessment of usefulness and reliability of data for its purpose. This process is often referred to as Data Profiling: a subjective discovery to understand your data and its usability relative to the standards defined by the user.
In 2020 the Data Management Association (DAMA) compiled a list of 65 dimensions and subdimensions for Data Quality, with 12 of these being marked as ‘common’. Out of these twelve there are 6 core dimensions:
- Completeness:
— The main features required for analysis do not have missing values. - Uniqueness:
— Check that there is only one record of each observation in the data. - Timeliness and Currency:
— Data must be up to date and the most recent record reflects the most recent change. - Consistency:
— Minimize or remove contradictions within a dataset or between datasets. - Validity:
— Ensures data has the right type, format and is within acceptable range. - Accuracy:
— Measures the correctness of the form and content of data.
CONSISTENCY
Consistency is the uniformity within a dataset or how well it aligns with a source or reference dataset. When data is transacted between systems or databases there is a chance of errors occurring on record or attribute level during processing, which results in an inconsistency between the source and the target.
The most famous example of inconsistency is the game Telephone. The first player whispers a message in the next players ear, who passes the message on to the next player, and so on until it reaches the final target. Between each player (database) is a chance of missing a word (error) leading to a resulting message different from the source, inconsistency.
Inconsistency can also occur during creating of the data, for example when using different representation to express the same meaning. An employee database contains a column indicating which company an employee belongs to. Some of the values use the company code, while others use the company name and some even use just the initials of the company. Querying this database for all employees of a certain company will return skewed results.
A simple check can be the number of records in the source compared to the target.
SELECT
  source_table.primary_key,
  COUNT(*) AS num_rows,
  CASE
    WHEN COUNT(*) = COUNT(target_table.primary_key) THEN 'Consistent'
    ELSE 'Inconsistent'
  END AS consistency_status
FROM
  source_table
  LEFT JOIN target_table ON source_table.primary_key = target_table.primary_key
GROUP BY
  source_table.primary_key;
Inconsistencies can and will occur, and while computer programming provides a fairly easy way of checking data on inconsistency, the trouble is often in finding the ‘truth’. This search can include consulting a domain expert, comparing to multiple sources and applying your own or your stakeholders’ business judgements to develop a trustworthy score for your data.
VALIDITY
Validity describes how close a data value is to a predetermined standard or range. Examples could be business rules, numerical values, dates, or sequence-based processing of data values.
Let’s take a purchase order as an example of the importance of validity. When a buyer places a purchase order there is a business rule that states the total weight of the order should not exceed 1500kg to ensure save delivery. A loading weight exceeding the maximum capacity indicates invalid data according to that rule.
This same order gets an order date and a delivery date. If they buyer looks at the order and sees a delivery date that is before the order date, there is an obvious validation issue in the system.
A bit more on using range in validity:
For using a range in validation, for example in manufacturing processes, there is the initial proposition of an acceptable scope. During production there is constant measurements being compared to this range to validate the quality of the product. This assessment of the acceptable scope is often a statistical process.
But, widely used range-based statistics such as mean and standard deviation are sensitive to extreme values, which are called outliers. These outliers will have to be assessed to validate if they are legitimate extremes or if they are the result of flaws in the measuring tools.
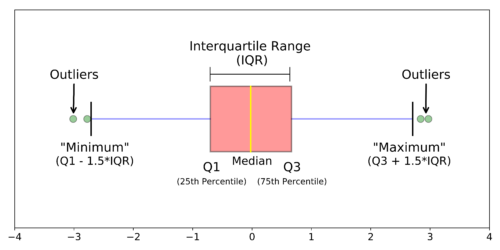
The boxplot is the simplest representation of a range and can point to outliers in your data. It is generated by plotting 5 important values: Minimum, Maximum, 25th Percentile, Median and the 75th Percentile. The Interquartile Range (IQR) is the range between the 25th and 75th Percentile, and 1.5 IQR distance is used to determine the validity of the outliers. Meaning: if a value is more than 1.5 IQR distance from the 25th or 75th percentile it is often classified as an outlier.
ACCURACY
Accuracy is the correctness of the form and content of data, for its purpose. It asks the question: to what degree does this data represent information related to an agreed-upon source?
Everyone is used to measuring accuracy daily. When you get a delivery after ordering something online, we check the content of the package against the invoice. Or skimming through the bill when you pay for your meal in a restaurant. We assess the accuracy of the data presented to us against the agreed-upon source.
The manual testing of accuracy is not a scalable solution for the large amounts of data generated by companies, but that scale also makes the assessment method more important. A somewhat simple example would be to compare postal codes to a standardized reference database, but even in such a basic operation the form already plays a part. Are you just comparing digits (1234) or including characters as well (1234 QW).
Accuracy is hard to measure metric for data quality. It involves exploratory analysis and statistics to identify trends and values that might not make sense. This requires domain knowledge, consulting an expert or running your data against trustworthy sources to determine if your findings ‘make sense’ within the context of the dataset.
As we conclude this article on data quality, we hope you have gained valuable insights and understanding of it’s core dimensions. To further expand your knowledge and explore additional educational content, be sure to check out our comprehensive resources available on this website.
Also follow us on Instagram, TikTok, LinkedIn, YouTube for more information and don’t hesitate to contact us!