Talend: tips and tricks part 2
In the first part of these entries we discussed how to test your expressions, the importance of optimizing the appearance of a tLogRow component and how to handle windows and views within Talend. This time around, we will be talking about the different ways to get components into your job, how to trace your dataflow and how to easily sync columns. As last time, this post will be useful for both starting and experienced users.
4. Getting components into your job
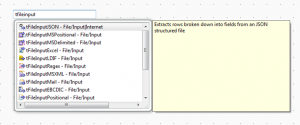
There are many ways to get components into your job. Most people search the palette (by either the search-function or by manually exploring the folders) and drag/drop the components into their job. You can achieve the same thing by simply clicking on a random place in your job and then type the name of the component. Obviously this is only recommended once you’re familiar with the different components and their names.
When working with metadata, you can use certain shortcuts to save a bit of time. Usually people just click on the metadata and then drop it onto their job. This will pop up a window allowing you to choose which type of component you want to use. Holding the Control-key while dragging the component will directly create an Output-component. Holding Control+Shift will result into an Input-component.
5. Syncing columns
Occasionally, you may have to change the schema of a certain component in the middle of development. This might affect other components in your job. In some cases, Talend asks if you want to propagate the changes you’ve made (to the other components).
You may accidently close this window, click “No” or not get this message at all, resulting in the following error: “The schema from the input link “youroutputlink” is different from the schema defined in the component”.
When this happens, you can go to the basic settings of the component that has the error and click on “Sync columns”. The error should now be gone.
6. Tracing your dataflow (Debug Run)
Lastly, I would like to say a few words about the debug run. In some cases we want to closely watch our dataflow in order to get a better understanding of what’s exactly happening. You can achieve this by running your job in debug mode. This can be done by clicking on the Run-window, then click on the “Debug Run” tab on the left side of the window and start it by clicking on “Traces Debug”.
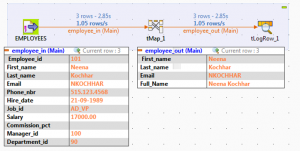
The moment you open the “Debug run” tab, you’ll immediately see extra icons in your job. These magnifying glass icons indicate that details will be shown when you debug-run your job. The result should look something like this:
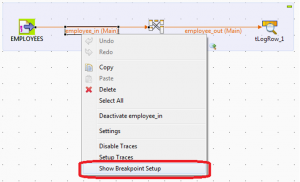
You can Pause and Resume the run at any time. You can also add breakpoints if you like. Do this by right-clicking on a dataflow and then selecting “Show Breakpoint Setup”.
This brings you to the “Breakpoint” tab of the data flow you clicked on. You can also go there by clicking on the specific flow and manually selecting “Breakpoint”. Let’s add a breakpoint to pause our run whenever we come across a record with “Bloom” as last name. Firstly, make sure to check the “Activate conditional breakpoint” option. After that, click on the plus-icon underneath the conditions. Then select the InputColumn we want to put our condition on, in our case this is “Last_name”, and add a value (“Bloom” in this example). The default Operation is “Equals”, which is the one we want. You can also specify an Operation if you need to, but this is unnecessary for this case.
You can add multiple breakpoints if you like. Whenever you debug run your job now, it will stop at a record where the Last_name is “Bloom” (if any exist).
That’s it for now. Thank you for reading!


